Data Visualization & Information Architecture
Architecting high-data-literacy analytics consoles, automated version compliance engines, and granular classroom performance metrics
Role: Lead Product Designer (Data Visualization & Reporting)
Key Learnings
- Data informed decisions, not data driven decisions
- What questions are you trying to answer with this data?
- Like any language, it takes practice
- Data cleaning can be frustrating, but always improve the result
- The visualization is just as good as the data you have available
Enterprise Implementation & Automation
Interventions for Higher Task Completion
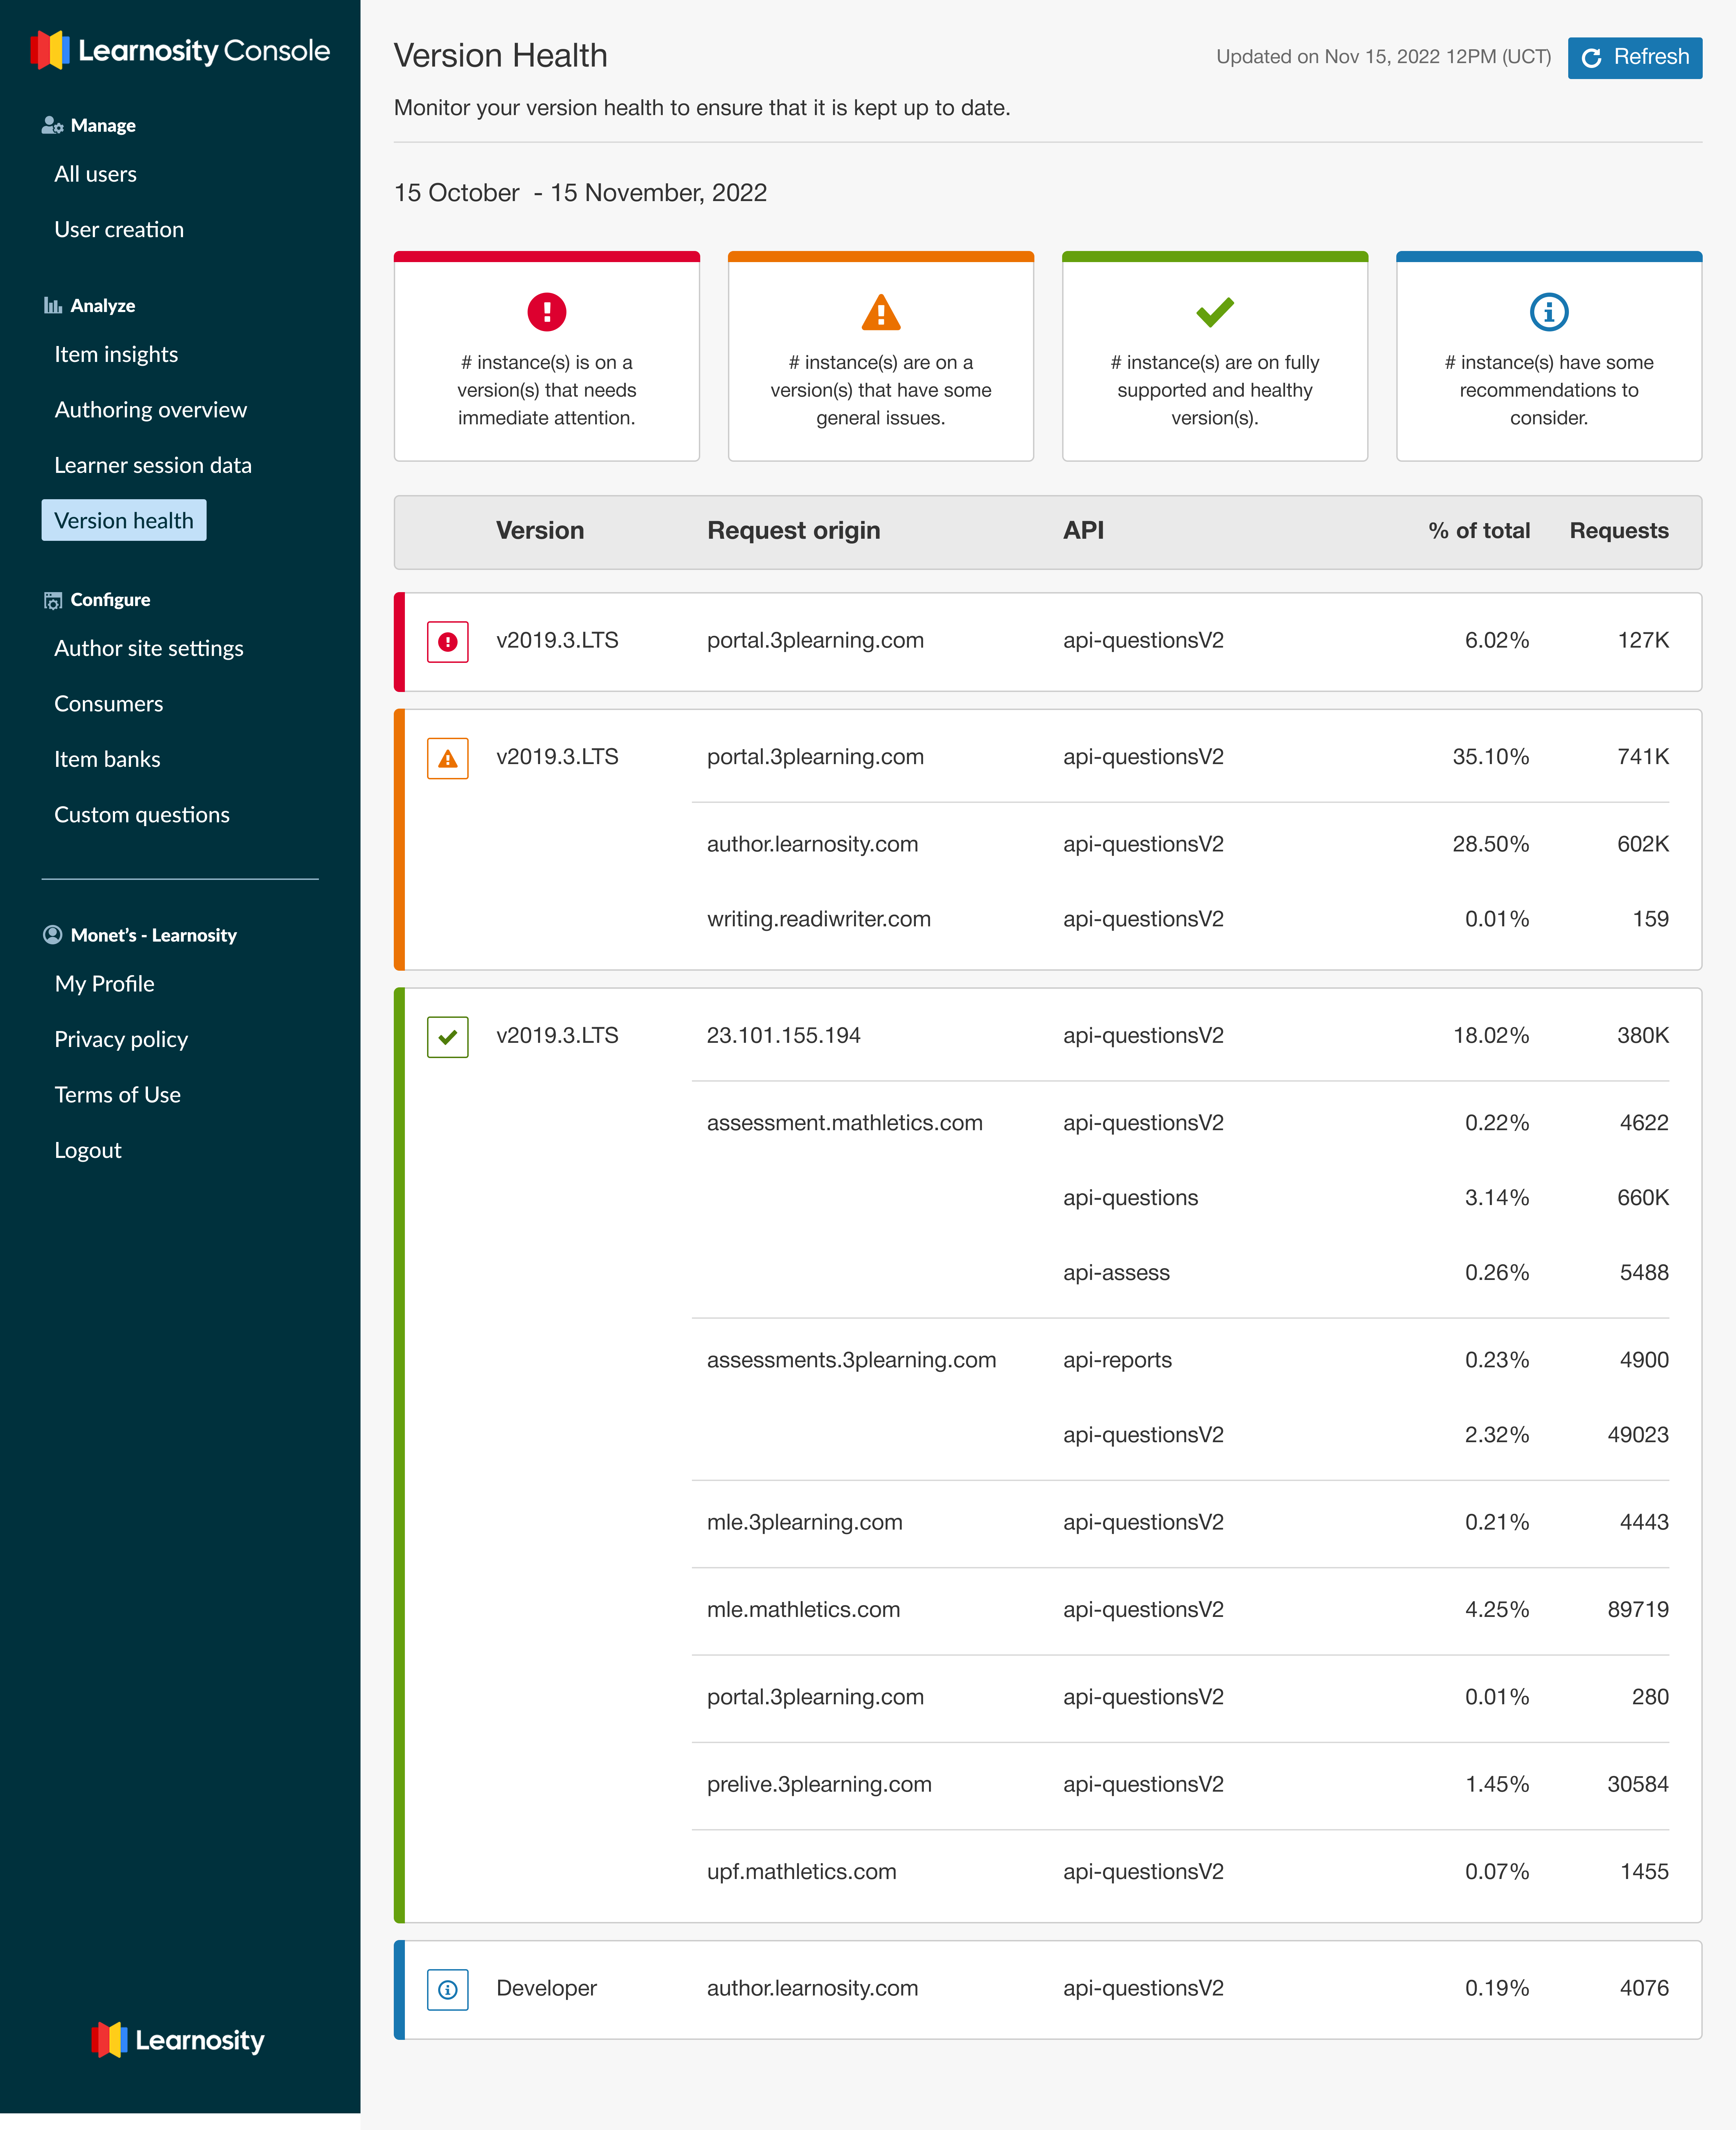
The Version Health & Long-Term Support (LTS) Reporting Engine: Data design is critical for technical system operations and retention health. To eliminate an unsustainable wave of engineering support tickets caused by outdated software configurations, I spearheaded an API exposure strategy. I designed a scalable Version Health Dashboard and LTS Versioning Report that translated highly complex deployment logs and feature-flag layers into an intuitive visual status engine. This system empowered enterprise clients with immediate, independent visibility into their active version compliance states, driving proactive customer updates and directly mitigating support ticket volume.
The Scoring Group Reportlet: In the classroom, data must move at the speed of thought. I architected the Learnosity Scoring Group Reportlet, a highly customizable and embeddable analytics layout that simplifies multi-layered student performance data. The UI allows educators to cluster, slice, and view test responses dynamically. Rather than overwhelming a teacher with raw test scores, the visual component aggregates performance across customizable scoring blocks, instantly highlighting learning gaps and providing explicit, immediate insights into student progress. View live demo
Advanced Coaching Report & Templates
Re-Designing the Classic Coaching Report
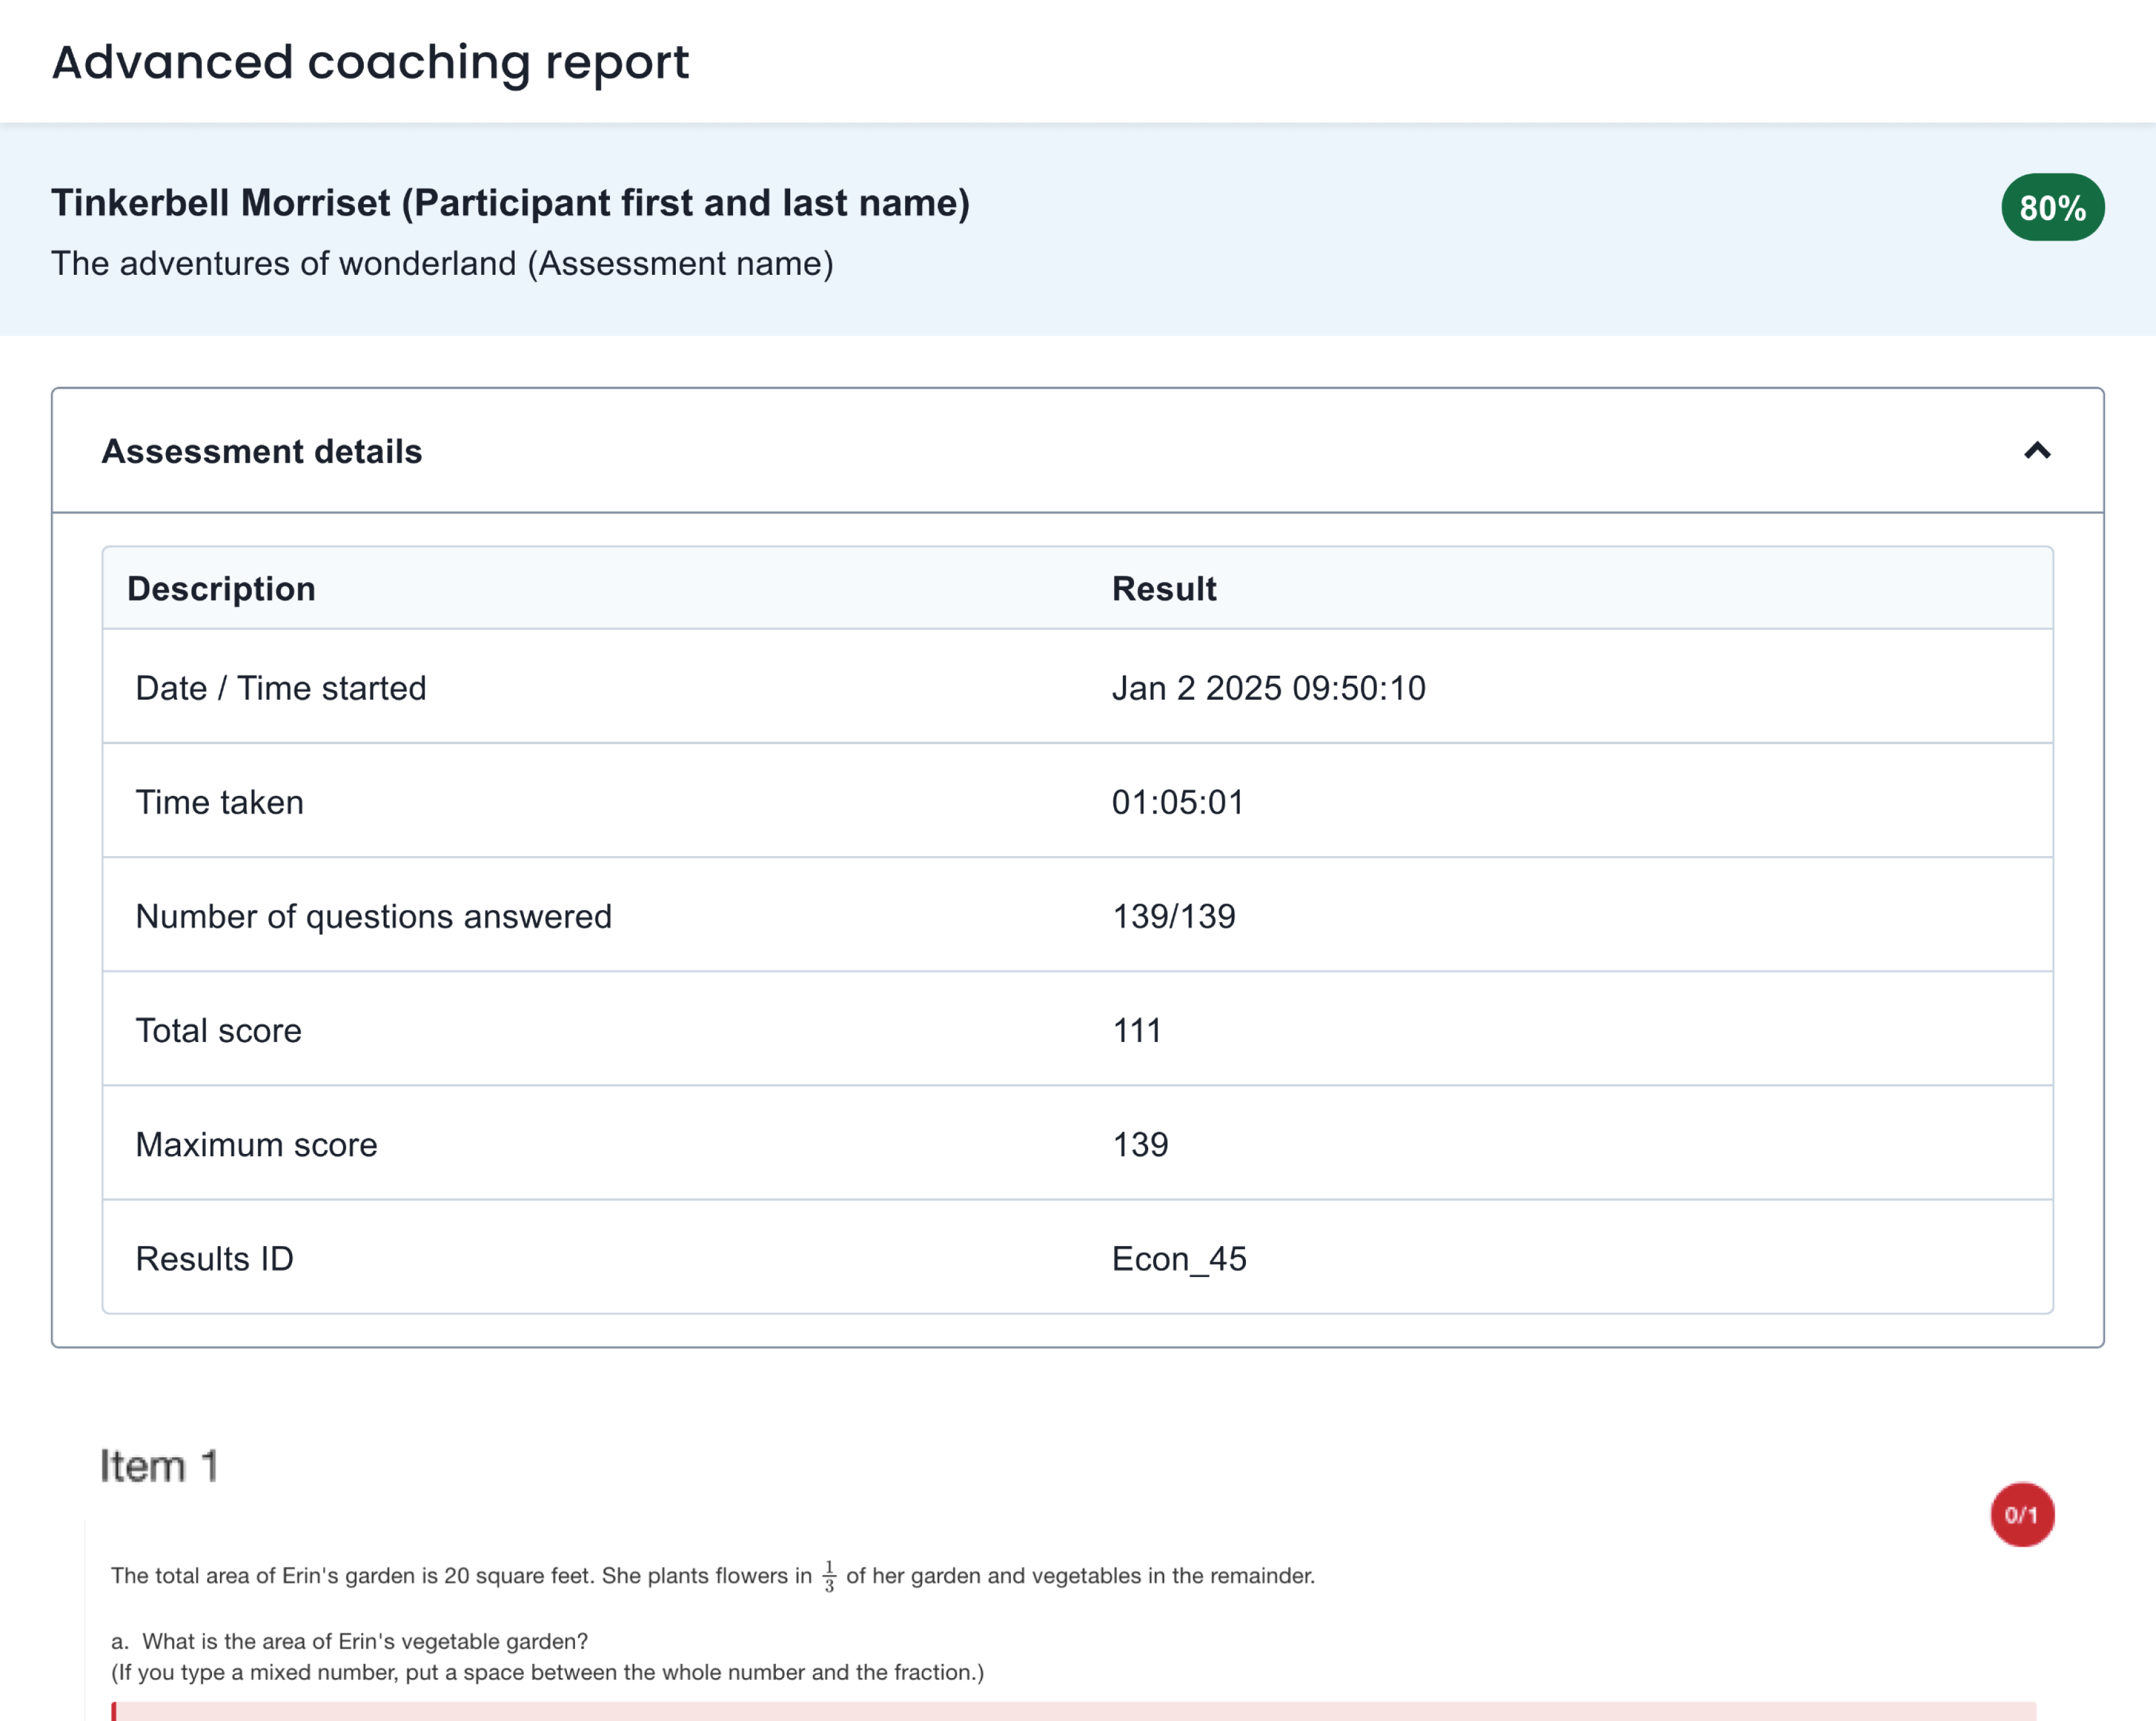
Enterprise educational platforms operating within the high-stakes professional certification market require absolute flexibility in how data is delivered. The resulting architecture empowers institutional administrators to build bespoke, results-focused report templates tailored precisely to their certification rubrics. The interface seamlessly handles data granularity, rendering overall student outcomes alongside highly detailed diagnostics for individual questions. By designing a system where every single panel, graph, data column, and metric container can be customized, we turned raw assessment logs into a premium, white-label product layer.
Mentorship & Storytelling with Data
High Data Literacy & Industry Leadership
Design specifications for complex analytics cannot rely on guesswork, they must be anchored in cognitive science and human data processing limits. Grounded in advanced Storytelling with Data methodologies, I look past surface-level layouts to focus on cognitive load reduction, precise pre-attentive attributes, and clear visual hierarchy.
My domain expertise extends directly into the global design community. As an active Data Visualization Society Mentor and published author in their journal, Nightingale ('Honing Your Skills in Data Visualization as a Designer'), I teach, critique, and audit data paradigms, translating these industry-level insights directly back into our core product line.